Top 10 Countries with the Highest Number of Foreign-Born Residents (Immigrants) - United Nations 2020:
Immigration is the international movement of people away from the country where they have citizenship (usually their country of birth) in favor of a destination country where they do not have citizenship. Immigrants, often referred to as foreign-born residents, move to a new country for several reasons, including searching for economic prosperity, job opportunities, family reunification, retirement, and better access to resources.
The proportion of immigrants varies considerably from country to country, and for several reasons. Some countries are —in fact, some countries will actually —while other countries are by comparison.
The United States is home to the highest number of immigrants in the world. An estimated 50.6 million people in the United States—a bit more than 15% of the total population of 331.4 million—were born in a foreign country. The number of immigrants in the U.S. has increased by at least 400% since 1965. The population of immigrants in the United States is incredibly diverse, with nearly every country in the world represented among U.S. immigrants. Mexico is the leading origin country for U.S. immigrants, accounting for more than 11 million, roughly 25%, of all immigrants in the United States. Immigration, of course, played a formative role in making the U.S. the country it is today: except for those whose ancestors arrived as slaves, the majority of citizens of the "Great American Melting Pot" are descended from immigrants—and early European settlers in particular.
Perhaps the most unique entry in the top ten is the United Arab Emirates, whose 8.7 million immigrants make up nearly 89% of the country's total population. This gives the UAE one of the world's highest proportions of immigrant residents in relation to the total national population.
What is the difference between immigrants and emigrants?
The difference between the words "immigration/immigrant" and "emigration/emigrant" can be confusing. Technically speaking, the two terms are opposites, but it can be difficult to tell from their definitions. An immigrant is someone who came to the country where they now live from somewhere else. In contrast, an emigrant is someone who left their home country and moved somewhere else. In other words, the person moving is both an immigrant and an emigrant, depending upon whether the person speaking or writing the word lives in the home country or the destination country.
This nuance is often easier to understand with an example: Imagine a person who was born in South Africa, but now lives permanently in the United States. To their new friends in the U.S., that person is an immigrant, because they immigrated to—or came to—the United States. But to their old friends in South Africa, that same person is an emigrant because they emigrated from—or left—South Africa.
When used in the context of national populations, "immigrants" refers to foreign-born residents who have moved to that country and "emigrants" refers to people who have left that country to live somewhere else.
Top 10 Countries with the Highest Number of Emigrants (Former Residents living Internationally) - United Nations 2020:
India has the largest number of natives living abroad with 17.9 million people in total. Emigrant numbers are not always as accurate as immigrant numbers, mostly because most governments are not as concerned about those who leave the country as they are about those who enter and use government-funded services or infrastructure. There are exceptions to this logic, however, as countries such as North Korea and Taliban-controlled Afghanistan take a keen interest in preventing residents from emigrating.
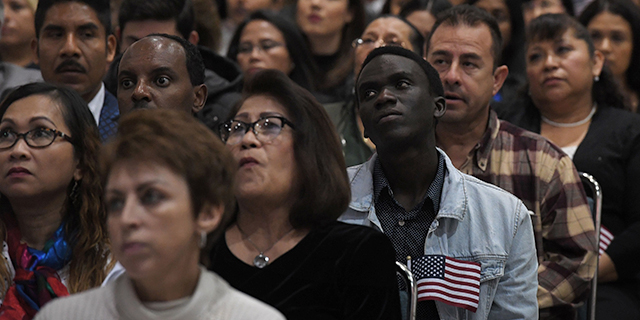
Immigrants listen to a speech as they wait to become U.S. citizens at a naturalization ceremony in Los Angeles. (Mark Ralson/AFP/Getty Images)
The United States has more immigrants than any other country in the world. Today, more than 40 million people living in the U.S. were born in another country, accounting for about one-fifth of the world's migrants. The population of immigrants is also very diverse, with just about every country in the world represented among U.S. immigrants.
Pew Research Center regularly publishes statistical portraits of the nation's foreign-born population, which include historical trends since 1960. Based on these portraits, here are answers to some key questions about the U.S. immigrant population.
How many people in the U.S. are immigrants?
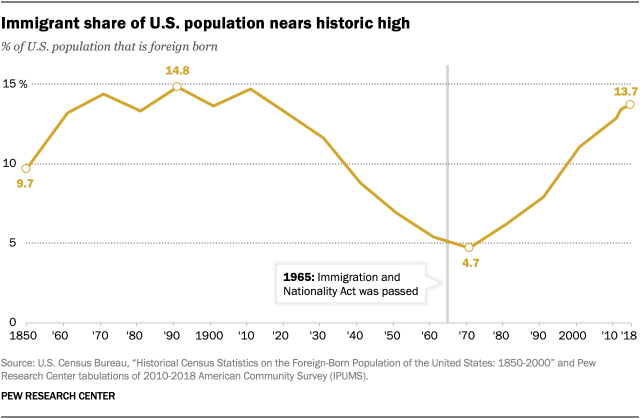
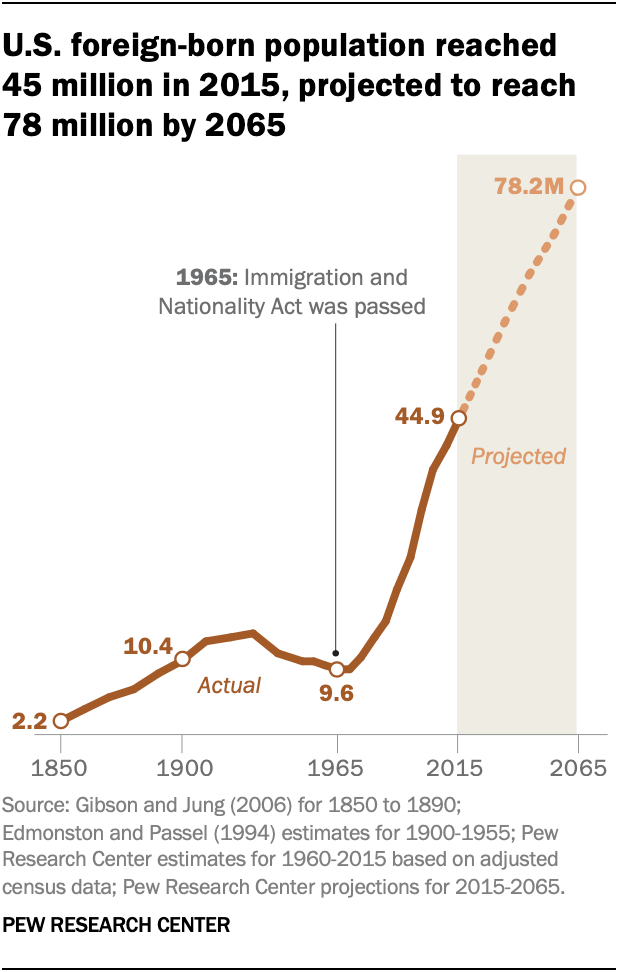
The U.S. foreign-born population reached a record 44.8 million in 2018. Since 1965, when U.S. immigration laws replaced a national quota system, the number of immigrants living in the U.S. has more than quadrupled. Immigrants today account for 13.7% of the U.S. population, nearly triple the share (4.8%) in 1970. However, today's immigrant share remains below the record 14.8% share in 1890, when 9.2 million immigrants lived in the U.S.
What is the legal status of immigrants in the U.S.?
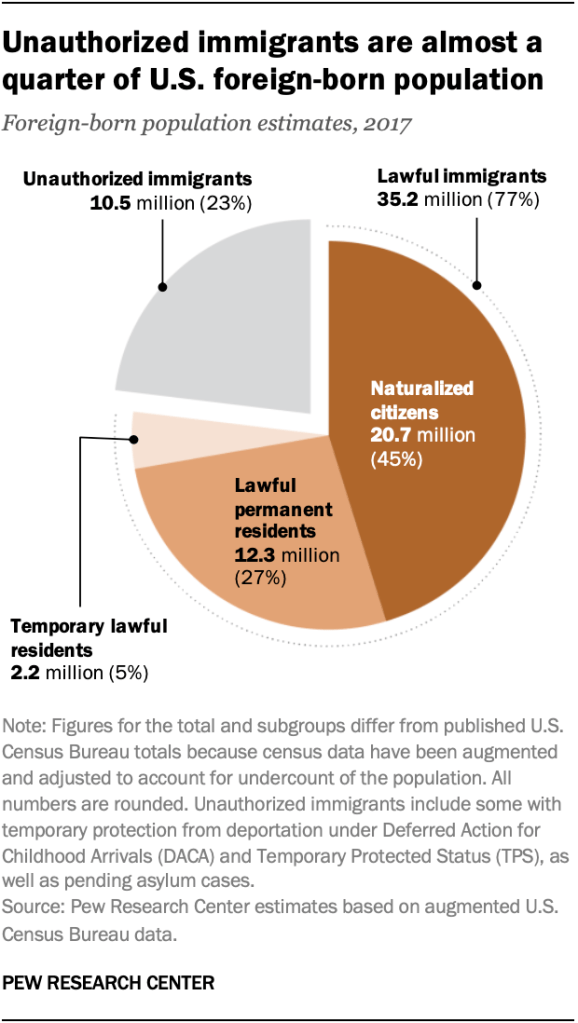
Some 27% of immigrants were permanent residents and 5% were temporary residents in 2017. Another 23% of all immigrants were unauthorized immigrants. From 1990 to 2007, the unauthorized immigrant population more than tripled in size – from 3.5 million to a record high of 12.2 million in 2007. By 2017, that number had declined by 1.7 million, or 14%. There were 10.5 million unauthorized immigrants in the U.S. in 2017, accounting for 3.2% of the nation's population.
The decline in the unauthorized immigrant population is due largely to a fall in the number from Mexico – the single largest group of unauthorized immigrants in the U.S. Between 2007 and 2017, this group decreased by 2 million. Meanwhile, there was a rise in the number from Central America and Asia.
Do all lawful immigrants choose to become U.S. citizens?
Not all lawful permanent residents choose to pursue U.S. citizenship. Those who wish to do so may apply after meeting certain requirements, including having lived in the U.S. for five years. In fiscal year 2019, about 800,000 immigrants applied for naturalization. The number of naturalization applications has climbed in recent years, though the annual totals remain below the 1.4 million applications filed in 2007.
Generally, most immigrants eligible for naturalization apply to become citizens. However, Mexican lawful immigrants have the lowest naturalization rate overall. Language and personal barriers, lack of interest and financial barriers are among the top reasons for choosing not to naturalize cited by Mexican-born green card holders, according to a 2015 Pew Research Center survey.
Where do immigrants come from?
Mexico is the top origin country of the U.S. immigrant population. In 2018, roughly 11.2 million immigrants living in the U.S. were from there, accounting for 25% of all U.S. immigrants. The next largest origin groups were those from China (6%), India (6%), the Philippines (4%) and El Salvador (3%).
By region of birth, immigrants from Asia combined accounted for 28% of all immigrants, close to the share of immigrants from Mexico (25%). Other regions make up smaller shares: Europe, Canada and other North America (13%), the Caribbean (10%), Central America (8%), South America (7%), the Middle East and North Africa (4%) and sub-Saharan Africa (5%).
Who is arriving today?
More than 1 million immigrants arrive in the U.S. each year. In 2018, the top country of origin for new immigrants coming into the U.S. was China, with 149,000 people, followed by India (129,000), Mexico (120,000) and the Philippines (46,000).
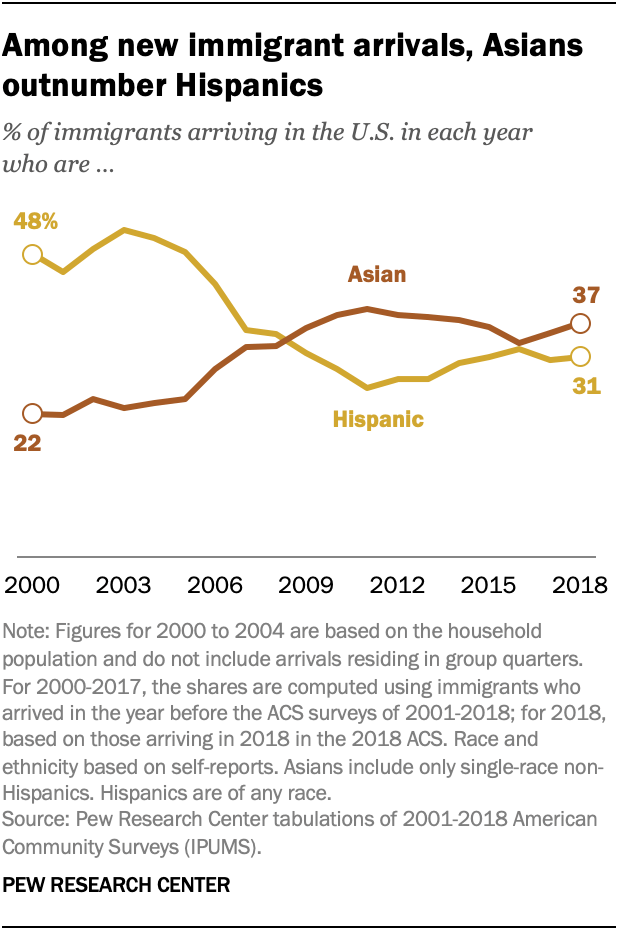
By race and ethnicity, more Asian immigrants than Hispanic immigrants have arrived in the U.S. in most years since 2009. Immigration from Latin America slowed following the Great Recession, particularly for Mexico, which has seen both decreasing flows into the United States and large flows back to Mexico in recent years.
Asians are projected to become the largest immigrant group in the U.S. by 2055, surpassing Hispanics. Pew Research Center estimates indicate that in 2065, those who identify as Asian will make up some 38% of all immigrants; as Hispanic, 31%; White, 20%; and Black, 9%.
Is the immigrant population growing?
New immigrant arrivals have fallen, mainly due to a decrease in the number of unauthorized immigrants coming to the U.S. The drop in the unauthorized immigrant population can primarily be attributed to more Mexican immigrants leaving the U.S. than coming in.
Looking forward, immigrants and their descendants are projected to account for 88% of U.S. population growth through 2065, assuming current immigration trends continue. In addition to new arrivals, U.S. births to immigrant parents will be important to future growth in the country's population. In 2018, the percentage of women giving birth in the past year was higher among immigrants (7.5%) than among the U.S. born (5.7%). While U.S.-born women gave birth to more than 3 million children that year, immigrant women gave birth to about 760,000.
How many immigrants have come to the U.S. as refugees?
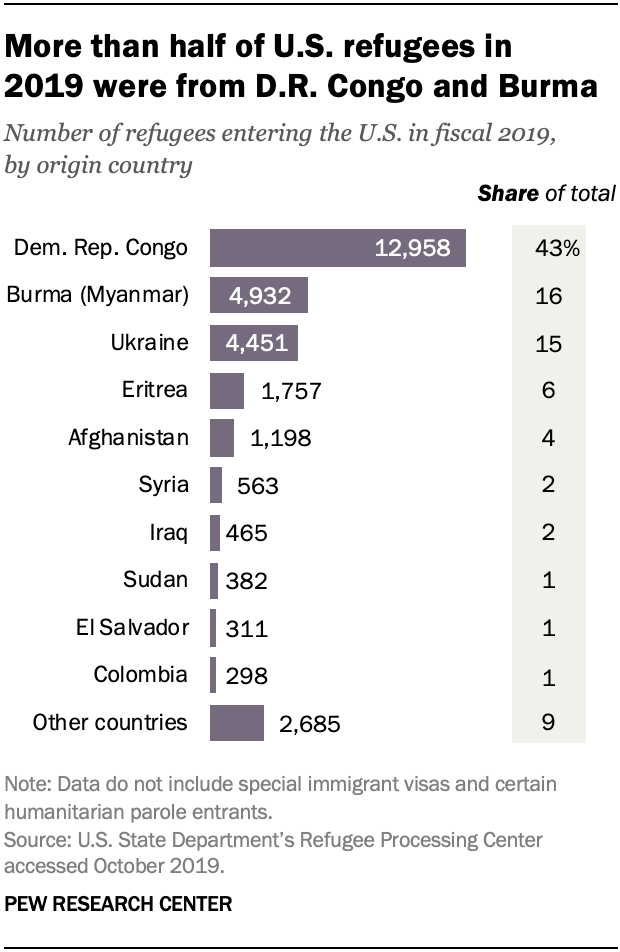
In fiscal 2019, a total of 30,000 refugees were resettled in the U.S. The largest origin group of refugees was the Democratic Republic of the Congo, followed by Burma (Myanmar), Ukraine, Eritrea and Afghanistan. Among all refugees admitted in fiscal year 2019, 4,900 are Muslims (16%) and 23,800 are Christians (79%). Texas, Washington, New York and California resettled more than a quarter of all refugees admitted in fiscal 2018.
Where do most U.S. immigrants live?
Nearly half (45%) of the nation's immigrants live in just three states: California (24%), Texas (11%) and Florida (10%). California had the largest immigrant population of any state in 2018, at 10.6 million. Texas, Florida and New York had more than 4 million immigrants each.
In terms of regions, about two-thirds of immigrants lived in the West (34%) and South (34%). Roughly one-fifth lived in the Northeast (21%) and 11% were in the Midwest.
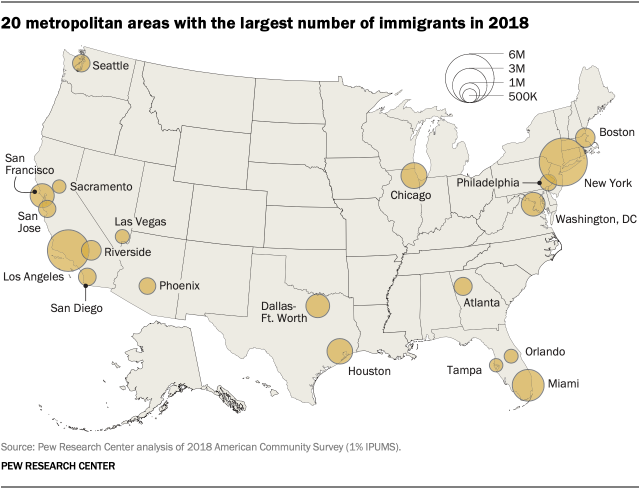
In 2018, most immigrants lived in just 20 major metropolitan areas, with the largest populations in the New York, Los Angeles and Miami metro areas. These top 20 metro areas were home to 28.7 million immigrants, or 64% of the nation's total foreign-born population. Most of the nation's unauthorized immigrant population lived in these top metro areas as well.
How do immigrants compare with the U.S. population overall in education?
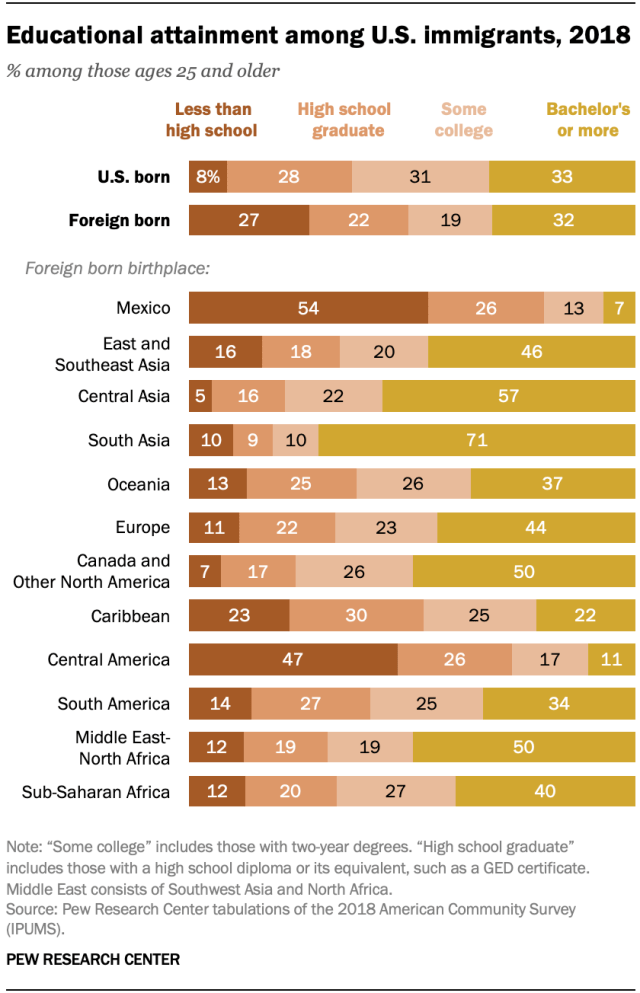
Immigrants in the U.S. as a whole have lower levels of education than the U.S.-born population. In 2018, immigrants were over three times as likely as the U.S. born to have not completed high school (27% vs. 8%). However, immigrants were just as likely as the U.S. born to have a bachelor's degree or more (32% and 33%, respectively).
Educational attainment varies among the nation's immigrant groups, particularly across immigrants from different regions of the world. Immigrants from Mexico and Central America are less likely to be high school graduates than the U.S. born (54% and 47%, respectively, do not have a high school diploma, vs. 8% of U.S. born). On the other hand, immigrants from every region except Mexico, the Caribbean and Central America were as likely as or more likely than U.S.-born residents to have a bachelor's or advanced degree.
Among all immigrants, those from South Asia (71%) were the most likely to have a bachelor's degree or more. Immigrants from Mexico (7%) and Central America (11%) were the least likely to have a bachelor's or higher.
How many immigrants are working in the U.S.?
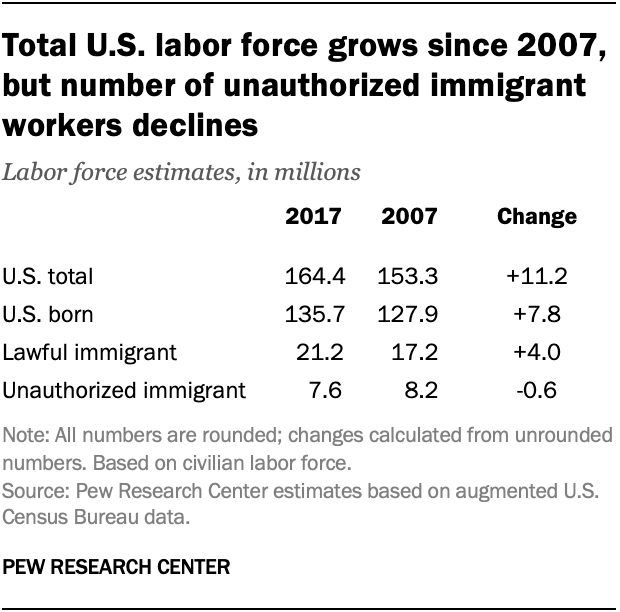
In 2017, about 29 million immigrants were working or looking for work in the U.S., making up some 17% of the total civilian labor force. Lawful immigrants made up the majority of the immigrant workforce, at 21.2 million. An additional 7.6 million immigrant workers are unauthorized immigrants, less than the total of the previous year and notably less than in 2007, when they were 8.2 million. They alone account for 4.6% of the civilian labor force, a dip from their peak of 5.4% in 2007. During the same period, the overall U.S. workforce grew, as did the number of U.S.-born workers and lawful immigrant workers.
Immigrants are projected to drive future growth in the U.S. working-age population through at least 2035. As the Baby Boom generation heads into retirement, immigrants and their children are expected to offset a decline in the working-age population by adding about 18 million people of working age between 2015 and 2035.
How well do immigrants speak English?
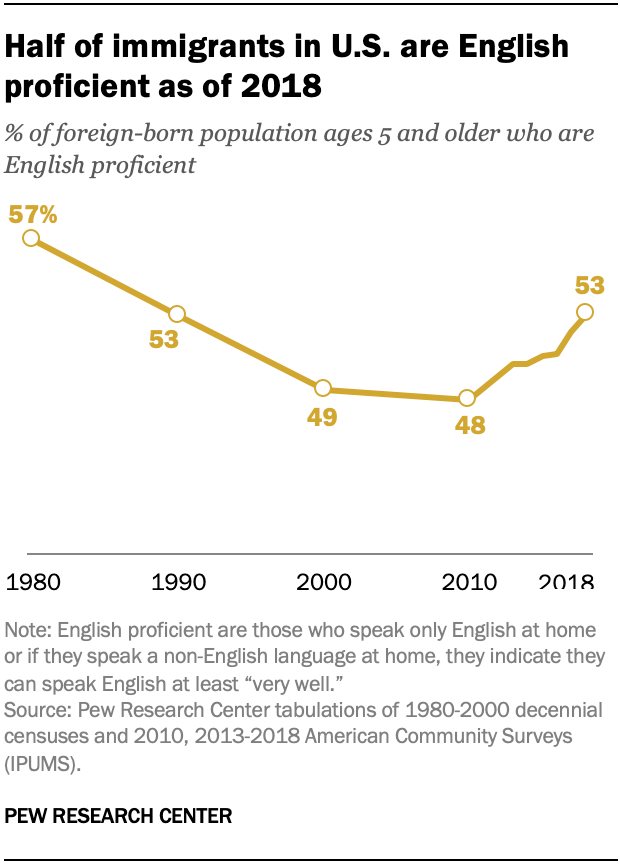
Among immigrants ages 5 and older in 2018, half (53%) are proficient English speakers – either speaking English very well (37%) or only speaking English at home (17%).
Immigrants from Mexico have the lowest rates of English proficiency (34%), followed by those from Central America (35%), East and Southeast Asia (50%) and South America (56%). Immigrants from Canada (96%), Oceania (82%), Europe (75%) and sub-Saharan Africa (74%) have the highest rates of English proficiency.
The longer immigrants have lived in the U.S., the greater the likelihood they are English proficient. Some 47% of immigrants living in the U.S. five years or less are proficient. By contrast, more than half (57%) of immigrants who have lived in the U.S. for 20 years or more are proficient English speakers.
Among immigrants ages 5 and older, Spanish is the most commonly spoken language. Some 42% of immigrants in the U.S. speak Spanish at home. The top five languages spoken at home among immigrants outside of Spanish are English only (17%), followed by Chinese (6%), Hindi (5%), Filipino/Tagalog (4%) and French (3%).
How many immigrants have been deported recently?
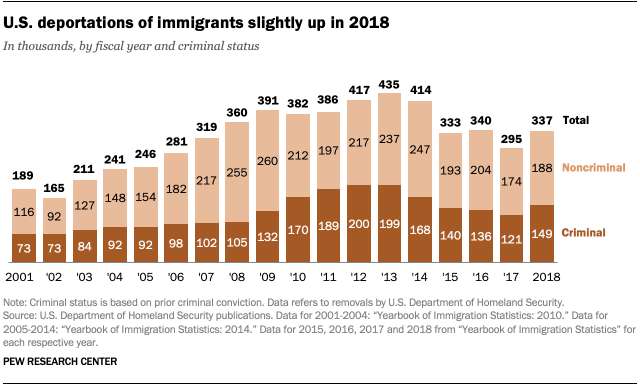
Around 337,000 immigrants were deported from the U.S. in fiscal 2018, up since 2017. Overall, the Obama administration deported about 3 million immigrants between 2009 and 2016, a significantly higher number than the 2 million immigrants deported by the Bush administration between 2001 and 2008. In 2017, the Trump administration deported 295,000 immigrants, the lowest total since 2006.
Immigrants convicted of a crime made up the less than half of deportations in 2018, the most recent year for which statistics by criminal status are available. Of the 337,000 immigrants deported in 2018, some 44% had criminal convictions and 56% were not convicted of a crime. From 2001 to 2018, a majority (60%) of immigrants deported have not been convicted of a crime.
How many immigrant apprehensions take place at the U.S.-Mexico border?
The number of apprehensions at the U.S.-Mexico border has doubled from fiscal 2018 to fiscal 2019, from 396,579 in fiscal 2018 to 851,508 in fiscal 2019. Today, there are more apprehensions of non-Mexicans than Mexicans at the border. In fiscal 2019, apprehensions of Central Americans at the border exceeded those of Mexicans for the fourth consecutive year. The first time Mexicans did not make up the bulk of Border Patrol apprehensions was in 2014.
How do Americans view immigrants and immigration?
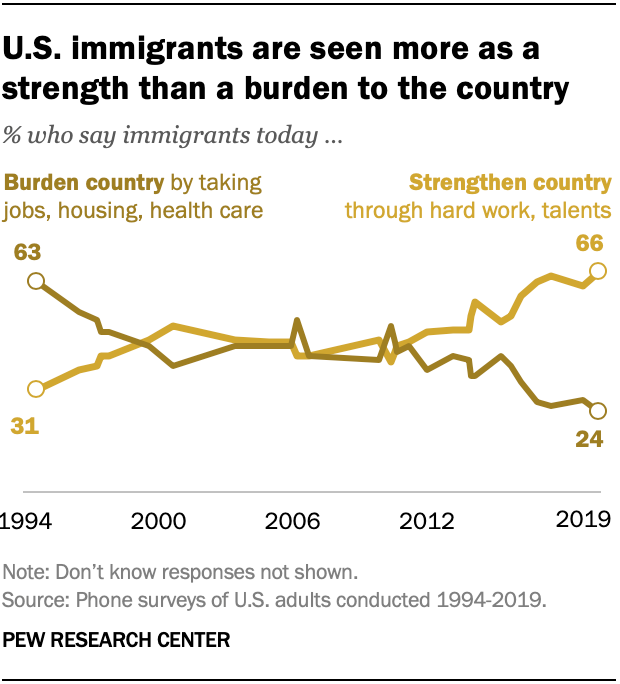
While immigration has been at the forefront of a national political debate, the U.S. public holds a range of views about immigrants living in the country. Overall, a majority of Americans have positive views about immigrants. About two-thirds of Americans (66%) say immigrants strengthen the country "because of their hard work and talents," while about a quarter (24%) say immigrants burden the country by taking jobs, housing and health care.
Yet these views vary starkly by political affiliation. Among Democrats and Democratic-leaning independents, 88% think immigrants strengthen the country with their hard work and talents, and just 8% say they are a burden. Among Republicans and Republican-leaning independents, 41% say immigrants strengthen the country, while 44% say they burden it.
Americans were divided on future levels of immigration. A quarter said legal immigration to the U.S. should be decreased (24%), while one-third (38%) said immigration should be kept at its present level and almost another third (32%) said immigration should be increased.
Note: This is an update of a post originally published May 3, 2017, and written by Gustavo López, a former research analyst focusing on Hispanics, immigration and demographics; and Kristen Bialik, a former research assistant.
CORRECTION (Sept. 21, 2020): An update to the methodology used to tabulate figures in the chart "Among new immigrant arrivals, Asians outnumber Hispanics" has changed all figures from 2001 and 2012. This new methodology has also allowed the inclusion of the figure from 2000. Furthermore, the earlier version of the chart incorrectly showed the partial year shares of Hispanic and Asian recent arrivals in 2015; the corrected complete year shares are 31% and 36%, respectively.
Abby Budimanis a former research analyst focusing on race and ethnicity research at Pew Research Center.
Last week, North Korea assumed control as the chair of the United Nations Conference on Disarmament, the U.N. forum for negotiating multilateral disarmament efforts across the globe. It's the latest in a string of questionable moves the U.N. has taken in putting nation officials in contradictory positions.
North Korea officially took over the U.N. disarmament conference on Monday,according to NK News. The U.N. move quickly drew criticism from nongovernmental organizations that noted North Korea's major nuclear weapons development efforts in recent months.
"North Korea has just taken over as chair of the Conference on Disarmament here at the United Nations in Geneva," tweeted United Nations Watch executive director Hillel Neuer.
"This is not a joke. When they preside at tomorrow's meeting, our coalition of 40 UN-accredited NGOs is calling on all democracies to walk out."
"Having the North Korean regime of Kim Jong-un preside over global nuclear weapons disarmament will be like putting a serial rapist in charge of a women's shelter," Neuer added.
Neuer also circulated an appeal for countries to walk out of the U.N. disarmament conference. "Our appeal for countries to walk out, signed by 40 civil society groups worldwide."
"This is a country that threatens to attack other UN member states with missiles, and that commits atrocities against its own people," Neuer added in the statement.
"Torture and starvation are routine in North Korean political prison camps where an estimated 100,000 people are held in what is one of the world's most dire human-rights situations."
According to U.N. Watch, North Korea will lead the disarmament conference from May 30 until June 24. While North Korea will only control the disarmament forum for about four weeks, it will have presiding authority over multiple arms control discussions, including the discussion topics of "Cessation of the nuclear arms race and nuclear disarmament" and "Prevention of nuclear war, including all related matters."
The U.N. has faced criticism for other controversial picks to lead major initiatives.
In May 2020, the U.N. also named Chinese leader Xi Jinping's wife Peng Liyuan as a World Health Organization Goodwill Ambassador. Peng had been photographed in a Chinese military uniform singing for Chinese troops at Tiananmen Square in 1989 after they violently dispersed protestors in an event known as the Tiananmen Square Massacre.
The U.N. also named Chinese television anchor James Chau as a goodwill ambassador. Neuer noted Chau had broadcasted the Chinese government's forced confession of captured British national, Peter Humphrey, who was made to confess to stealing the data of Chinese citizens.
Ingenious 'Bionic Reading' System Will Help You Read Faster Online
It's fair to say many of us spend a lot of time reading online. Whether it's required for work, or you happen to do most of your reading on a screen—news, ebooks, social media, etc.—the constant blue light glare and small fonts can take their toll. Not only can screentime cause eye strain and headaches, but for some, there's a feeling of frustration and the sense that they're just not fully comprehending what they're spending so much time reading.
Enter Bionic Reading, a reading system developed by Swiss typographic designer Renato Casutt. Built on the concept that your brain reads faster than your eyes, it involves bolding the first few letters of each word. These bolded letters create "artificial fixation points," which allow your eyes to "skip" over words while your brain center automatically fills in the rest and still absorbs the meaning. This relieves some of the eye strain caused by reading on a screen, and it enhances comprehension—you're able to grasp the meaning of texts with less intentional effort. Reading in this mode does feel a bit, well, bionic. "It's incredible how reading this feels like finally unlocking 100% of your brain," Juan Buis, a UX writer for the likes of Spotify and Minecraft, tweeted.
Like so many clever discoveries, this one was stumbled upon by accident. While designing a book for an author in a foreign language, Casutt struggled to read its words but realized he could relate those words to his own language by sectioning them off. Readers who have tested his theory agree that it improves their reading speed and comprehension, including those with dyslexia.
After working tirelessly for six years to develop Bionic Reading, Casutt has just recently been overwhelmed with messages regarding the tool. He's continued to test it and fine-tune its capabilities. So far, it can be tailored to accommodate the preferences of each reader. Options include being able to increase or decrease the number of bolded letters, how often they appear, and the opacity of the bolded letters. There are also options to change the font and font size, as well as to adjust the line height, spacing, and column width—basically, everything that impacts the comfort of online reading.
Casutt's goal is for Bionic Reading to be integrated into all existing apps and services. "In a digital world dominated by shallow forms of reading," the website says, "Bionic Reading aims to encourage a more in-depth reading and understanding of written content."
You can try out the Bionic Reading Converter for free by uploading text or a link, and a browser extension is in the works. A Bionic Reading API will make the reading mode available in your favorite reading app. Right now, you can experience using the prototypes in the apps Reeder 5, Fiery Feeds, and Lire.
Do you feel like you read a lot on a screen but have trouble comprehending what you're reading? Bionic Reading can help.
The reading system is built on the concept that your brain reads faster than your eyes, and it bolds the first few letters of each word. You can try it yourself by pasting a link or text into the website.
Bionic Reading will automatically bold part of the text, and you can adjust it to your liking.
FDA and Pfizer Knew COVID Shot Caused Immunosuppression
April 1, 2022, another batch of 11,000 Pfizer documents were released by the U.S. Food and Drug Administration. Pfizer trial data reveal natural immunity was as effective as the jab, and that shot side effects were more severe in those under 55.
With another batch of 11,000 Pfizer documents, released April 1, 2022, old suspicions have gained fresh support. As reported by "Rising" cohost Kim Iversen (video above), the first bombshell revelation is that natural immunity works, and Pfizer has known it all along.
The clinical trial data showed there was no difference in outcomes between those with previous COVID infection and those who got the shot. Neither group experienced severe infection. Natural immunity was also statistically identical to the shot in terms of the risk of infection.
Younger Adults More Likely to Experience Side Effects
The second revelation is that side effects from the shots were more severe in younger people, aged 18 to 55, than those aged 55 and older. (The risk of side effects also increased with additional doses, so the risk was higher after the second dose than the first.)
As many of us have said all along, the risk of severe COVID is dramatically lower in younger people than those over 60, which makes an elevated risk of side effects unacceptable.
As noted by The Naked Emperor on Substack,[1] "with a vaccine that is producing more frequent and more severe reactions and adverse events in younger individuals, the vaccine should have been restricted to those who were actually at risk of severe COVID-19."
Pfizer Documents Show High Rate of Myocarditis
Interestingly, Pfizer's documentation also includes medical information that mainstream media and fact checkers have labeled as misinformation or disinformation. A pediatric consent form lists several possible side effects, including a myocarditis rate of 10 in 100,000 — far greater than the 1 in 50,000 (i.e., 2 in 100,000) rate previously reported.
We also know that myocarditis is far more frequent in young males, so for them, the risk is significantly higher than 10 in 100,000, as they make up the bulk of these injuries.
Antibody-Dependent Enhancement Has Not Been Ruled Out
Many who have warned about the possibility of mRNA shots causing antibody-dependent enhancement (ADE) — a situation in which you end up being more susceptible to serious infection than you would have been otherwise — have been smeared and demonized by media and labeled as disinformation spreaders.
Yet Pfizer's own consent form clearly states: "Although not seen to date, it cannot yet be ruled out that the studied vaccine can make a later COVID-19 illness more severe." As noted by Iversen, if ADE truly was of no concern at all, the consent form would not include it. Yet there it is.
Vaccine-associated enhanced disease (VAED) is also listed as an "Important Potential Risk" in Table 5 on page 11 of a document called "5.3.6 Cumulative Analysis of Post-Authorization Adverse Event Reports."[2]
As of February 28, 2021, Pfizer had 138 cases of suspected VAED, 75 of which were severe, resulting in hospitalization, disability, life-threatening consequences or death; a total of 38 cases turned out to be lethal and 65 remained unresolved.[3][4]
Moreover, as noted by the Daily Expose,[5] "Phase 3 clinical trials are designed to uncover frequent or severe side effects before a vaccine is approved for use, including ADE. But herein lies the problem, [because] none of the COVID-19 vaccines have completed Phase 3 trials."
Pfizer's Phase 3 trial is due to be completed February 8, 2024[6]— nearly two years from now! Despite that, Pfizer concluded in its FDA submission that "None of the 75 cases could be definitively considered as VAED."
"[H]ow on earth could they not definitively conclude that VAED was to blame when 75% of the confirmed 'break-through' cases reported to them were severe disease resulting in hospitalization, disability, life-threatening consequences of death?" The Daily Expose asks.[7]
Pfizer Knew About Immunosuppression
Another revealing statement found in the documents is this:
"Clinical laboratory evaluation showed a transient decrease in lymphocytes that was observed in all age and dose groups after Dose 1, which resolved within approximately one week …"
In other words, Pfizer knew that, in the first week after the shot, people of all ages experienced transient immunosuppression, or put another way, a temporary weakening of the immune system, after the first dose.
As noted by Iversen, this may have skewed infection rates, as people were not considered partially vaccinated until 14 days after their first shot,11 and officially fully vaccinated two weeks after the second dose.
If people are susceptible to infection during that first week, yet are counted as unvaccinated during that time, this makes it appear as though the unvaccinated are more prone to infection when that's simply not true. Pfizer's own trial showed infection was significantly more common in the vaccine group than the placebo group — 409 versus 287 — within the first seven days of the jab.
Fully Vaxxed Are More Likely to Die From COVID
The fact that Pfizer and the U.S. Food and Drug Administration were aware the shot caused immunosuppression is incriminating, now that U.K. government data show that, compared to the unvaccinated, those who have received two doses are:[8]
Up to three times more likely to be diagnosed with COVID-19
Twice more likely to be hospitalized with COVID-19
Three times more likely to die of COVID-19
The Pfizer documents admit there was a temporary drop in immune function after the first dose, but the real-world data showing an increased risk of severe infection and death due to COVID among the double jabbed suggest ADE may indeed be at play later on as well.
The chart below, created by the Daily Expose,[9] using data from the UKHSA Vaccine Surveillance Report for week 13, 2022[10] (pages 40 and 45), reveals who's more likely to get COVID. And the infection rate for triple-vaxxed is even higher than the double vaxxed.
The next chart was created by the Daily Expose[11] using data from pages 41 and 45, comparing COVID hospitalization rates.
And, finally, there is a comparison of the death rates, based on pages 44 and 45 of the UKHSA Vaccine Surveillance Report for week 13, 2022.[12] Anyone over the age of 40 who has been double jabbed is now more likely to die of COVID than an unvaccinated person of the same age.
Negative Vaccine Effectiveness in the Real World
The Daily Expose goes on to calculate and graph the real-world effectiveness rate of the COVID jab, and it's dire news:[13]
"If the rates per 100,000 are higher among the vaccinated, which they are, then this means the COVID-19 injections are proving to have a negative effectiveness in the real-world. And by using Pfizer's vaccine effectiveness formula we can accurately decipher what the real-world effectiveness among each age group actually is.
Pfizer's vaccine formula: Unvaccinated Rate per 100k – Vaccinated Rate per 100k / Unvaccinated Rate per 100k x 100 = Vaccine Effectiveness …
This data shows that all double vaccinated people over age 18 are between 2 and 3 times more likely to be infected, with a minus-87% vaccine effectiveness among 18 to 29 year olds, and a minus-178% vaccine effectiveness among the over 80's.
[A]ll double vaccinated people over age 30 are between 0.2 and 2 times more likely to be hospitalized, with a minus-1% vaccine effectiveness among 30 to 39 year olds, and a minus-76% vaccine effectiveness among the over 80's.
The following chart shows the real world COVID-19 vaccine effectiveness against death among the double vaccinated population in England, based on the death rates provided above …
[A]ll double vaccinated people over age 40 are between 2 and 3 times more likely to die of COVID-19, with a minus-90% vaccine effectiveness among 30 to 39 year olds, and a minus-156% vaccine effectiveness among the over 80's."
Pfizer Hired 600 to Process Unprecedented Report Load
For the last two years, we've been keeping an eye on the U.S. Vaccine Adverse Events Reporting System (VAERS), shaking our heads in disbelief as the numbers shot up by the hundreds every single week, rapidly outpacing injuries for every other vaccine combined over the past 32 years.[14]
As of March 25, 2022, there were 1,205,753 COVID jab-related reports, including 145,781 hospitalizations and 26,396 deaths.[15] There has never been a medical product in modern history that can compare. Nothing has been as injurious and lethal as these experimental injections.
In an earlier batch of documents, we learned Pfizer received 42,086 case reports containing a total of 158,893 events in the first three months of the rollout. In that release, the number of doses shipped was redacted, but in the April 1, 2022, release, it was left unredacted, which means we can now calculate the rate of adverse events reported to Pfizer in those first three months.
Between December 2020 and the end of February 2021, Pfizer shipped out 126,212,580 doses of its mRNA jab worldwide. Divided by 158,000 side effects, we get an adverse event rate per dose of nearly 1 in 800,[16] which is just crazy irresponsible.
We now also have documentation showing Pfizer, by the end of February 2021, had hired 600 additional full-time employees to process the unprecedented influx of adverse event reports, and they predicted that by the end of June 2021, they'd end up hiring more than 1,800.[17]
In the end, the COVID jab will go down in history as the biggest medical malfeasance ever to occur with the willing participation of both drug companies and regulatory agencies. And there's no end in sight.
In March 2022, the FDA went ahead and authorized doses 4 and 5, based on a preprint study[18][19] that found a fourth Moderna shot was 11% effective and caused side effects in 40% of recipients, and a fourth Pfizer shot was 30% effective and caused side effects in 80% of people.
I'm not sure what it'll take for this public health nightmare to end and for the responsible parties to be held to account for their criminal negligence, but apparently, we've not hit critical mass outrage yet.
Originally published April 14, 2022 on Mercola.com





 Bionic Reading:


