Thursday, June 12, 2025

Visa Outlook Explorer


so, where is Agriculture, farming…? 

>>>>>        3.7%        <<<<< !

https://www.brookings.edu/articles/visa-outlook-explorer/


Visa Distribution by Occupation

Selected Region: National
Total Projected Visa Demand: 7,245,328
Outlook Year: 2030
Business & Finance
813,404
Health & Human Services
1,070,386
Retail & Entertainment Services
2,148,599
STEM
342,042
Trades & Production
2,870,897

Focused Occupation Insights

Building Cleaning and Pest Control Workers
10.1%
582,635
Food and Beverage Serving Workers
19.5%
536,504
Cooks and Food Preparation Workers
20.1%
508,420
Material Moving Workers
11.6%
480,590
Construction Trades Workers
9.7%
451,487
Retail Sales Workers
4%
334,552
Motor Vehicle Operators
12.3%
262,506
Other Food Preparation and Serving Related Workers
23.8%
181,419
Agricultural Workers
3.7%
181,294
Grounds Maintenance Workers
10.1%
153,055
Information and Record Clerks
4.6%
130,613
Other Production Occupations
4%
122,475
Supervisors of Food Preparation and Serving Workers
21.5%
121,869
Food Processing Workers
8.2%
90,813
Assemblers and Fabricators
1.1%
73,642
Other Office and Administrative Support Workers
1.3%
70,115
Textile, Apparel, and Furnishings Workers
4.4%
69,602
Other Protective Service Workers
12.2%
57,406
Material Recording, Scheduling, Dispatching, and Distributing Workers
3.9%
56,480
Metal Workers and Plastic Workers
5.4%
54,662
Secretaries and Administrative Assistants
-1.1%
45,482
Entertainment Attendants and Related Workers
29.3%
32,604
Supervisors of Sales Workers
1.7%
28,098
Supervisors of Building and Grounds Cleaning and Maintenance Workers
9.2%
21,438
Other Construction and Related Workers
6.4%
15,549
Animal Care and Service Workers
24.6%
15,399
Other Transportation Workers
12%
14,936
Helpers, Construction Trades
8.4%
14,645
Supervisors of Transportation and Material Moving Workers
10.4%
13,411
Woodworkers
8.4%
10,819
Supervisors of Personal Care and Service Workers
19.2%
7,366
Extraction Workers
13.8%
6,941
Printing Workers
-4.5%
5,103
Forest, Conservation, and Logging Workers
1.1%
1,972
Rail Transportation Workers
4.1%
626
Funeral Service Workers
4.4%
403
Communications Equipment Operators
-12%
365
Home Health and Personal Care Aides; and Nursing Assistants, Orderlies, and Psychiatric Aides
16.3%
495,948
Computer Occupations
13.9%
225,290
Business Operations Specialists
10.5%
137,838
Other Personal Care and Service Workers
12%
121,312
Other Management Occupations
9.8%
107,298
Postsecondary Teachers
9%
104,650
Other Installation, Maintenance, and Repair Occupations
10.4%
101,635
Healthcare Diagnosing or Treating Practitioners
10.4%
89,484
Personal Appearance Workers
19.7%
79,547
Other Healthcare Support Occupations
14.5%
65,102
Top Executives
10.6%
61,291
Vehicle and Mobile Equipment Mechanics, Installers, and Repairers
7%
60,348
Other Educational Instruction and Library Occupations
7.4%
58,596
Financial Specialists
7.9%
53,872
Other Teachers and Instructors
12.9%
52,490
Financial Clerks
1.2%
51,781
Operations Specialties Managers
12.4%
47,881
Health Technologists and Technicians
9.3%
45,570
Engineers
9.6%
45,510
Preschool, Elementary, Middle, Secondary, and Special Education Teachers
7.3%
41,672
Sales Representatives, Services
9.1%
35,775
Entertainers and Performers, Sports and Related Workers
17.5%
32,147
Art and Design Workers
7.4%
30,231
Counselors, Social Workers, and Other Community and Social Service Specialists
10.6%
29,630
Supervisors of Construction and Extraction Workers
10.1%
28,599
Sales Representatives, Wholesale and Manufacturing
7.6%
24,696
Other Sales and Related Workers
5.5%
21,802
Supervisors of Office and Administrative Support Workers
3.5%
20,237
Media and Communication Workers
9.4%
19,103
Mathematical Science Occupations
23%
18,178
Advertising, Marketing, Promotions, Public Relations, and Sales Managers
11%
16,608
Supervisors of Production Workers
7.1%
15,817
Electrical and Electronic Equipment Mechanics, Installers, and Repairers
6.4%
12,241
Life Scientists
10.8%
11,912
Religious Workers
7.5%
11,349
Drafters, Engineering Technicians, and Mapping Technicians
6.3%
11,262
Physical Scientists
8.7%
10,191
Media and Communication Equipment Workers
13.1%
9,841
Supervisors of Installation, Maintenance, and Repair Workers
8.6%
8,572
Life, Physical, and Social Science Technicians
8.1%
8,019
Legal Support Workers
9.9%
7,014
Lawyers, Judges, and Related Workers
8.9%
6,529
Architects, Surveyors, and Cartographers
8.1%
5,975
Air Transportation Workers
14.2%
5,788
Supervisors of Farming, Fishing, and Forestry Workers
5.1%
5,713
Baggage Porters, Bellhops, and Concierges
23.1%
4,792
Law Enforcement Workers
2.8%
4,699
Occupational Therapy and Physical Therapist Assistants and Aides
22.7%
4,611
Librarians, Curators, and Archivists
5.6%
4,404
Social Scientists and Related Workers
6.1%
4,029
Plant and System Operators
1.4%
2,795
Tour and Travel Guides
19.9%
2,719
Other Healthcare Practitioners and Technical Occupations
11.5%
2,128
Occupational Health and Safety Specialists and Technicians
9.2%
1,676
Supervisors of Protective Service Workers
6.1%
1,545
Water Transportation Workers
10.2%
1,187
Firefighting and Prevention Workers
6.3%
1,102

~A.

How Much Does Immigration Data Explain the Employment-Gap Puzzle? - Liberty Street Economics


How Much Does Immigration Data Explain the Employment-Gap Puzzle? - Liberty Street Economics

How Much Does Immigration Data Explain the Employment‑Gap Puzzle?

Richard Audoly and Roshie Xing

?????? A puzzling feature of official U.S. employment statistics in recent years has been the increase in the gap between the nonfarm payroll and household employment numbers. This discrepancy is not trivial. From the end of 2021 though the end of 2024, net job gains in the payroll survey were 3.6 million larger than in the household survey. In this Liberty Street Economics post, we investigate one potential explanation for the emergence of this gap: a sharp rise in undocumented immigration during the post-COVID period that would be differentially reflected in the two surveys. We leverage industry-level data to study the relationship between our estimate of employment of likely undocumented migrants and the payroll-household employment gap. These data suggest that factors besides undocumented immigration likely contributed to the emergence of the gap between the two measures of U.S. employment.

The Payroll-Household Employment Gap

The Bureau of Labor Statistics measures employment in the United States through two monthly surveys. Nonfarm payroll employment is measured from the Current Employment Statistics (CES) survey of businesses and government agencies. The CES is commonly known as the establishment ("payroll") survey. Household employment is measured via the Current Population Survey (CPS) of U.S. households, which is also known as the "household" survey.

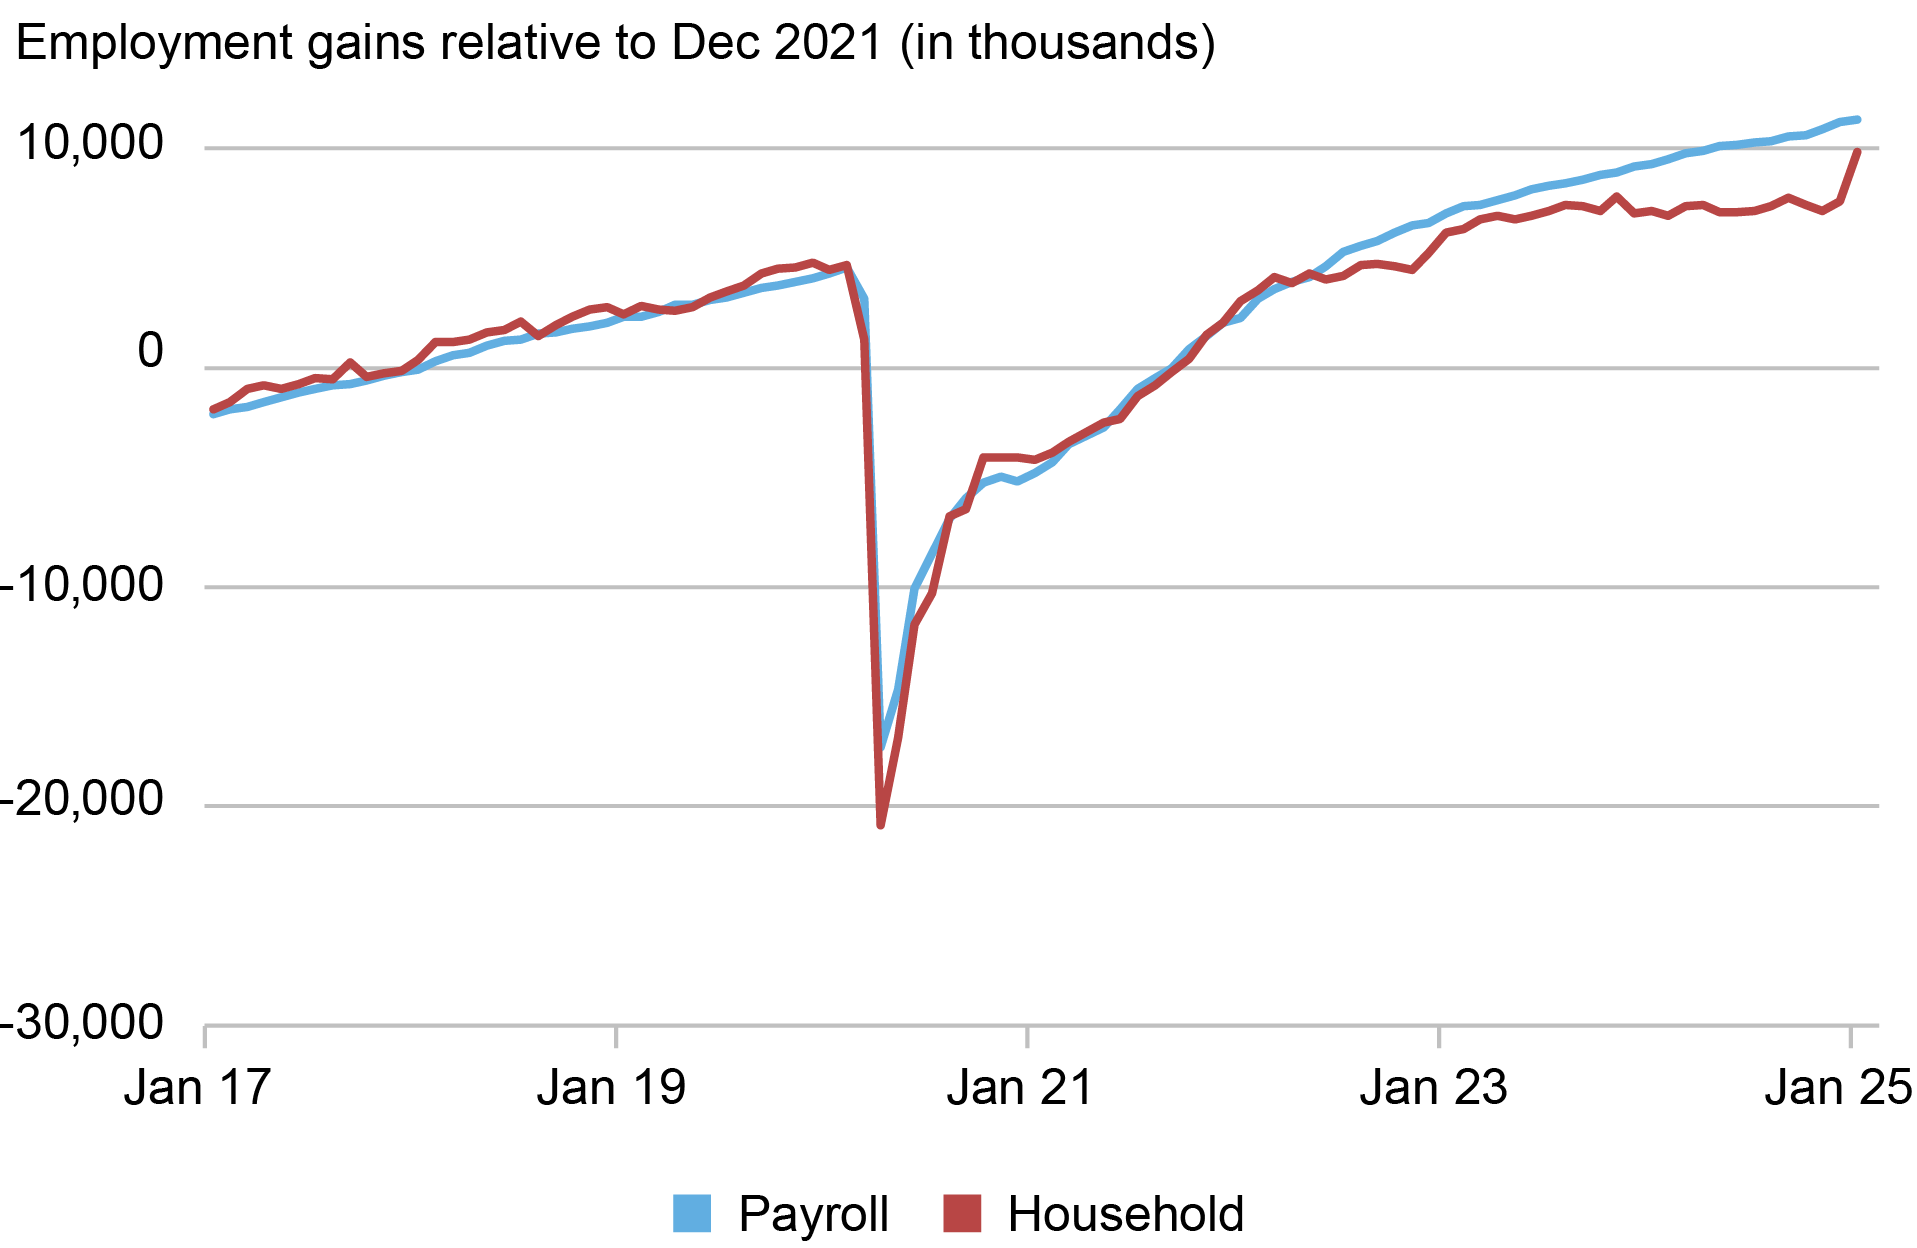
The chart below shows the employment gains in the two surveys. To highlight the evolution of the payroll-household employment gap, we express job creation relative to December 2021. Despite the methodological differences underlying the two surveys, the aggregate employment numbers tended to move in tandem prior to 2022. Both surveys imply that on net, roughly 4 million jobs were created between 2017 and 2022. But a sizable gap between the two employment estimates opens after 2022, with the establishment survey reporting 3.6 million more jobs than in the household survey as of December 2024.

Payroll and Household Employment Gains Started to Diverge in 2023

Line chart tracking employment gains relative to December 2021 in thousands (vertical axis) for payroll (blue) and household (red) surveys from 2017 through 2025 (horizontal axis); a sizable gap opens between the two surveys after 2022.
Sources: Bureau of Labor Statistics; authors' calculations.

Another striking feature of the employment numbers is the jump in household employment in January 2025, which closes the payroll-household gap by 2.1 million or 58.6 percent. This jump comes from updated population estimates from the Census Bureau, which are not applied retroactively. Put differently, the aggregate employment numbers in January 2025 are constructed with the latest population estimates, while the December 2024 numbers are derived from the previous estimates. As explained in a recent note by the Census Bureau, the updated population estimates reflect in part substantial adjustments for net international migration. So, could it be that the increase in undocumented immigration during the post-COVID period is better captured in payroll employment than in household employment? And could it account for part of the gap between the two surveys?  

Analyzing Undocumented Immigration

An obvious challenge for studying the role of undocumented immigration is that this group of respondents is difficult to track in government surveys. To make progress, we follow the procedure described in a recent paper by Borjas and Cassidy and impute the number of likely undocumented immigrants from the annual American Community Survey (ACS) Public Use Microdata Sample. In short, this approach starts from the group of survey respondents who are currently not naturalized citizens and uses a set of simple rules based on the information collected in the ACS to identify which of them are likely to be in the U.S. legally. Do they work in occupations that require a license? Are they married to an American citizen? Those left after all rules are applied are categorized as likely undocumented migrants. Since the ACS has information on the person's labor force status, we can further obtain an estimate of the number of likely undocumented migrants who are employed.

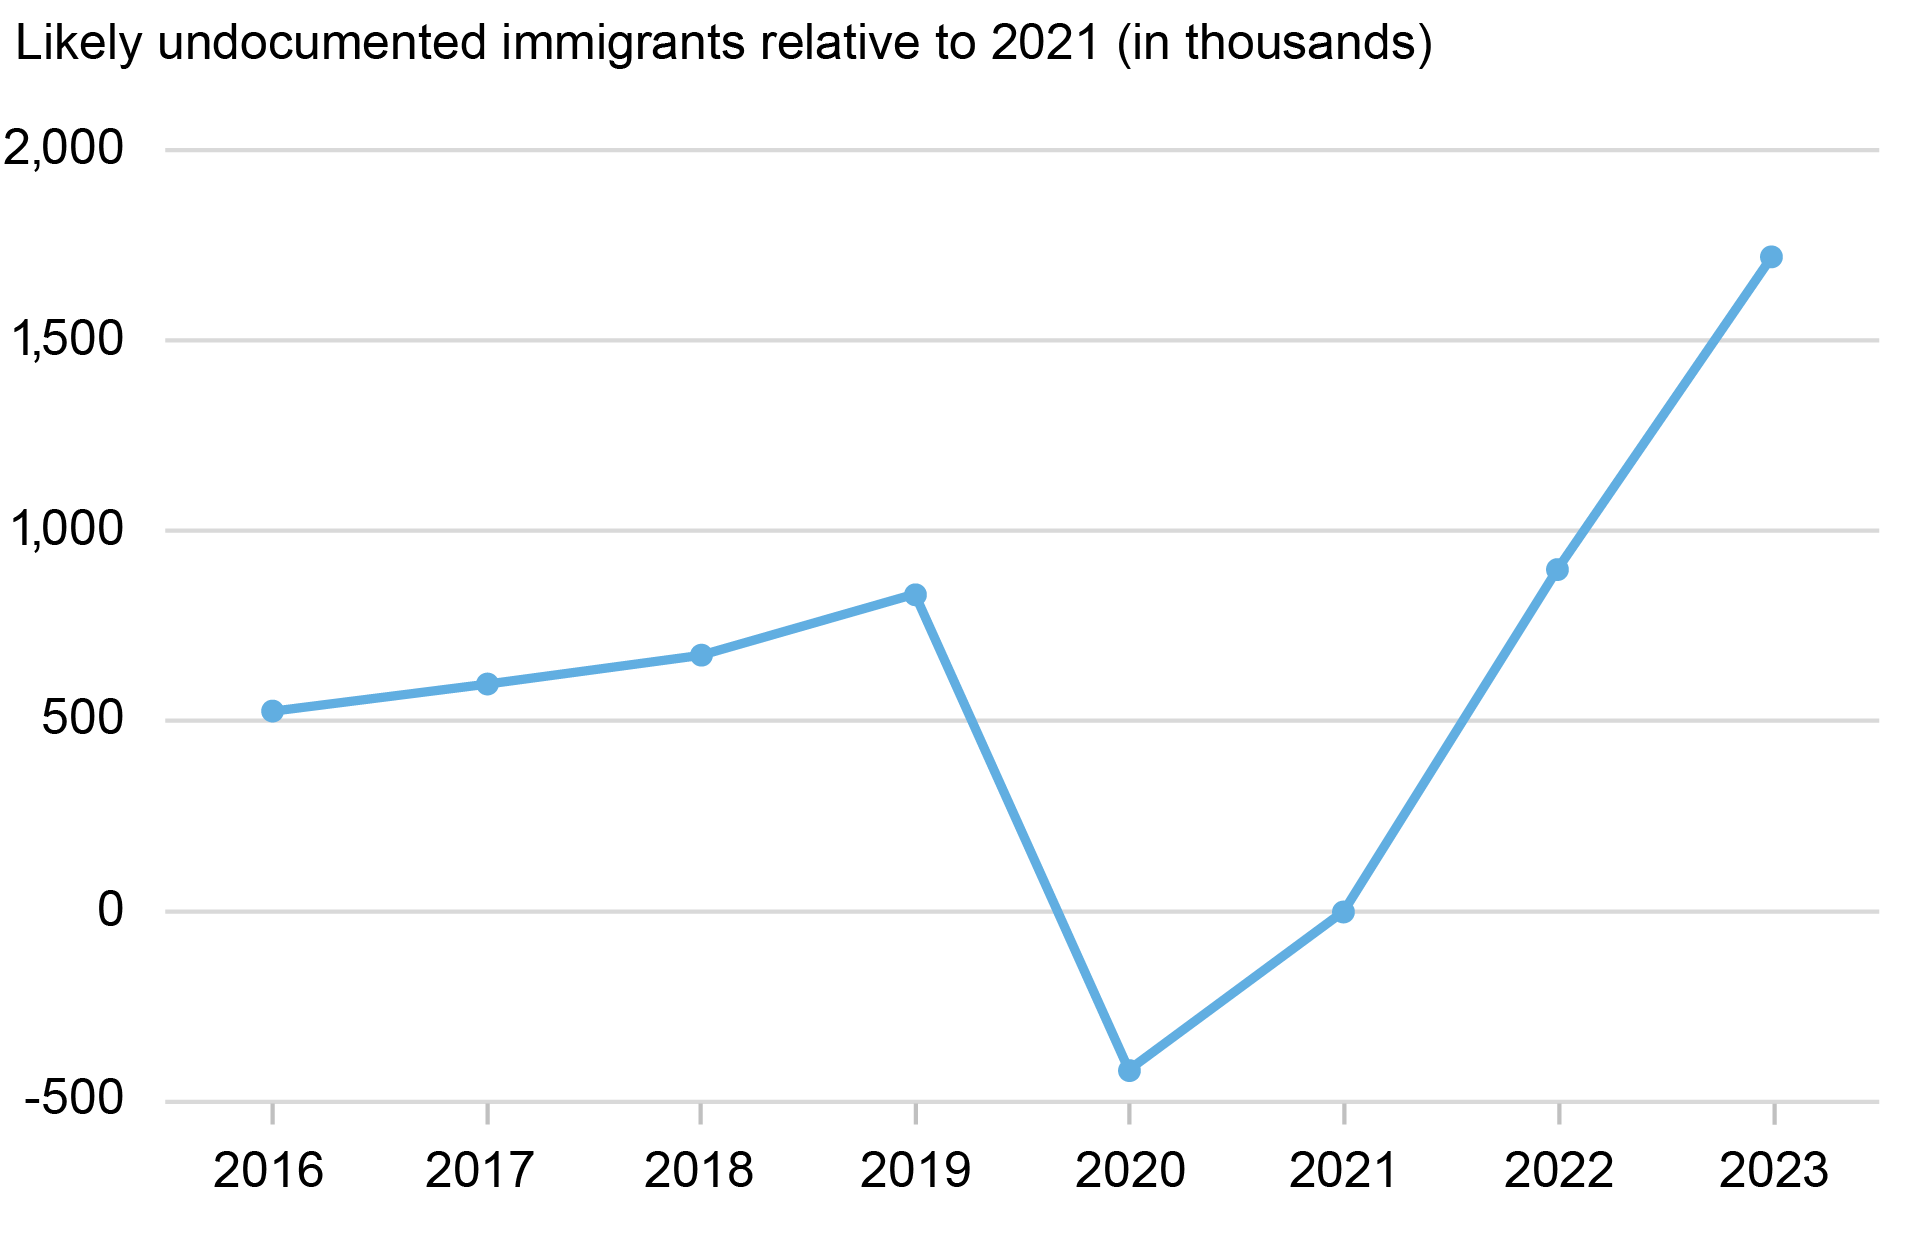
The evolution of the net employment gains of our measure of undocumented immigrants is shown below. Over the period 2021-23, the number of undocumented migrants who are employed increased by 1.72 million. In 2023, the latest ACS year available, our estimates imply that there were 8.65 million undocumented migrants in employment, or 5.2 percent of the U.S. total. Although there is considerable uncertainty around these numbers, at first glance, the 1.72 million increase is within the same range as the payroll-household employment gap of 2.12 million over the same period. So, the link between undocumented immigration and the employment gap seems plausible.

Our Estimate of Undocumented Immigrants Who Are Employed Also Increased Between 2021 and 2023

Line chart tracking likely undocumented immigrants relative to 2021 in thousands (vertical axis) from 2016 through 2023 (horizontal axis); chart shows a 1.72 million increase from 2021-2023 that fits within the same range as the payroll-household employment gap in the same period.
Sources: American Community Survey; authors' calculations.

Leveraging Industry-Level Variation

To investigate the link between the payroll-household gap and undocumented immigration more closely, we turn to industry-level data and ask: Are the industries that exhibit the largest increase in the payroll-household gap the same as those with the largest employment gains of likely undocumented migrants? The chart below shows the change in the payroll-household employment gap for thirteen key sectors since December 2021. The aggregate change in the gap over the period between December 2021 and December 2024, shown at the top of the figure, is primarily driven by changes in the payroll-household employment gap in the leisure and hospitality and education and health services sectors.

The Aggregate Change in the Payroll-Household Employment Gap Is Primarily Driven by Changes in the Leisure and Hospitality and Education and Health Sectors

Bar chart tracking the change in the payroll-household employment gap from December 2021 through December 2024 in thousands (horizontal axis) for various industries, from biggest increase to biggest losses from top to bottom (vertical axis); top increases are in the leisure and hospitality and the education and health services industries.
Sources: Bureau of Labor Statistics; American Community Survey; authors' calculations.
Notes: Industries are determined using NAICS two-digit codes. Seasonal adjustment of household employment was made by the authors. The numbers do not exactly sum up to the aggregate payroll-household employment gap.

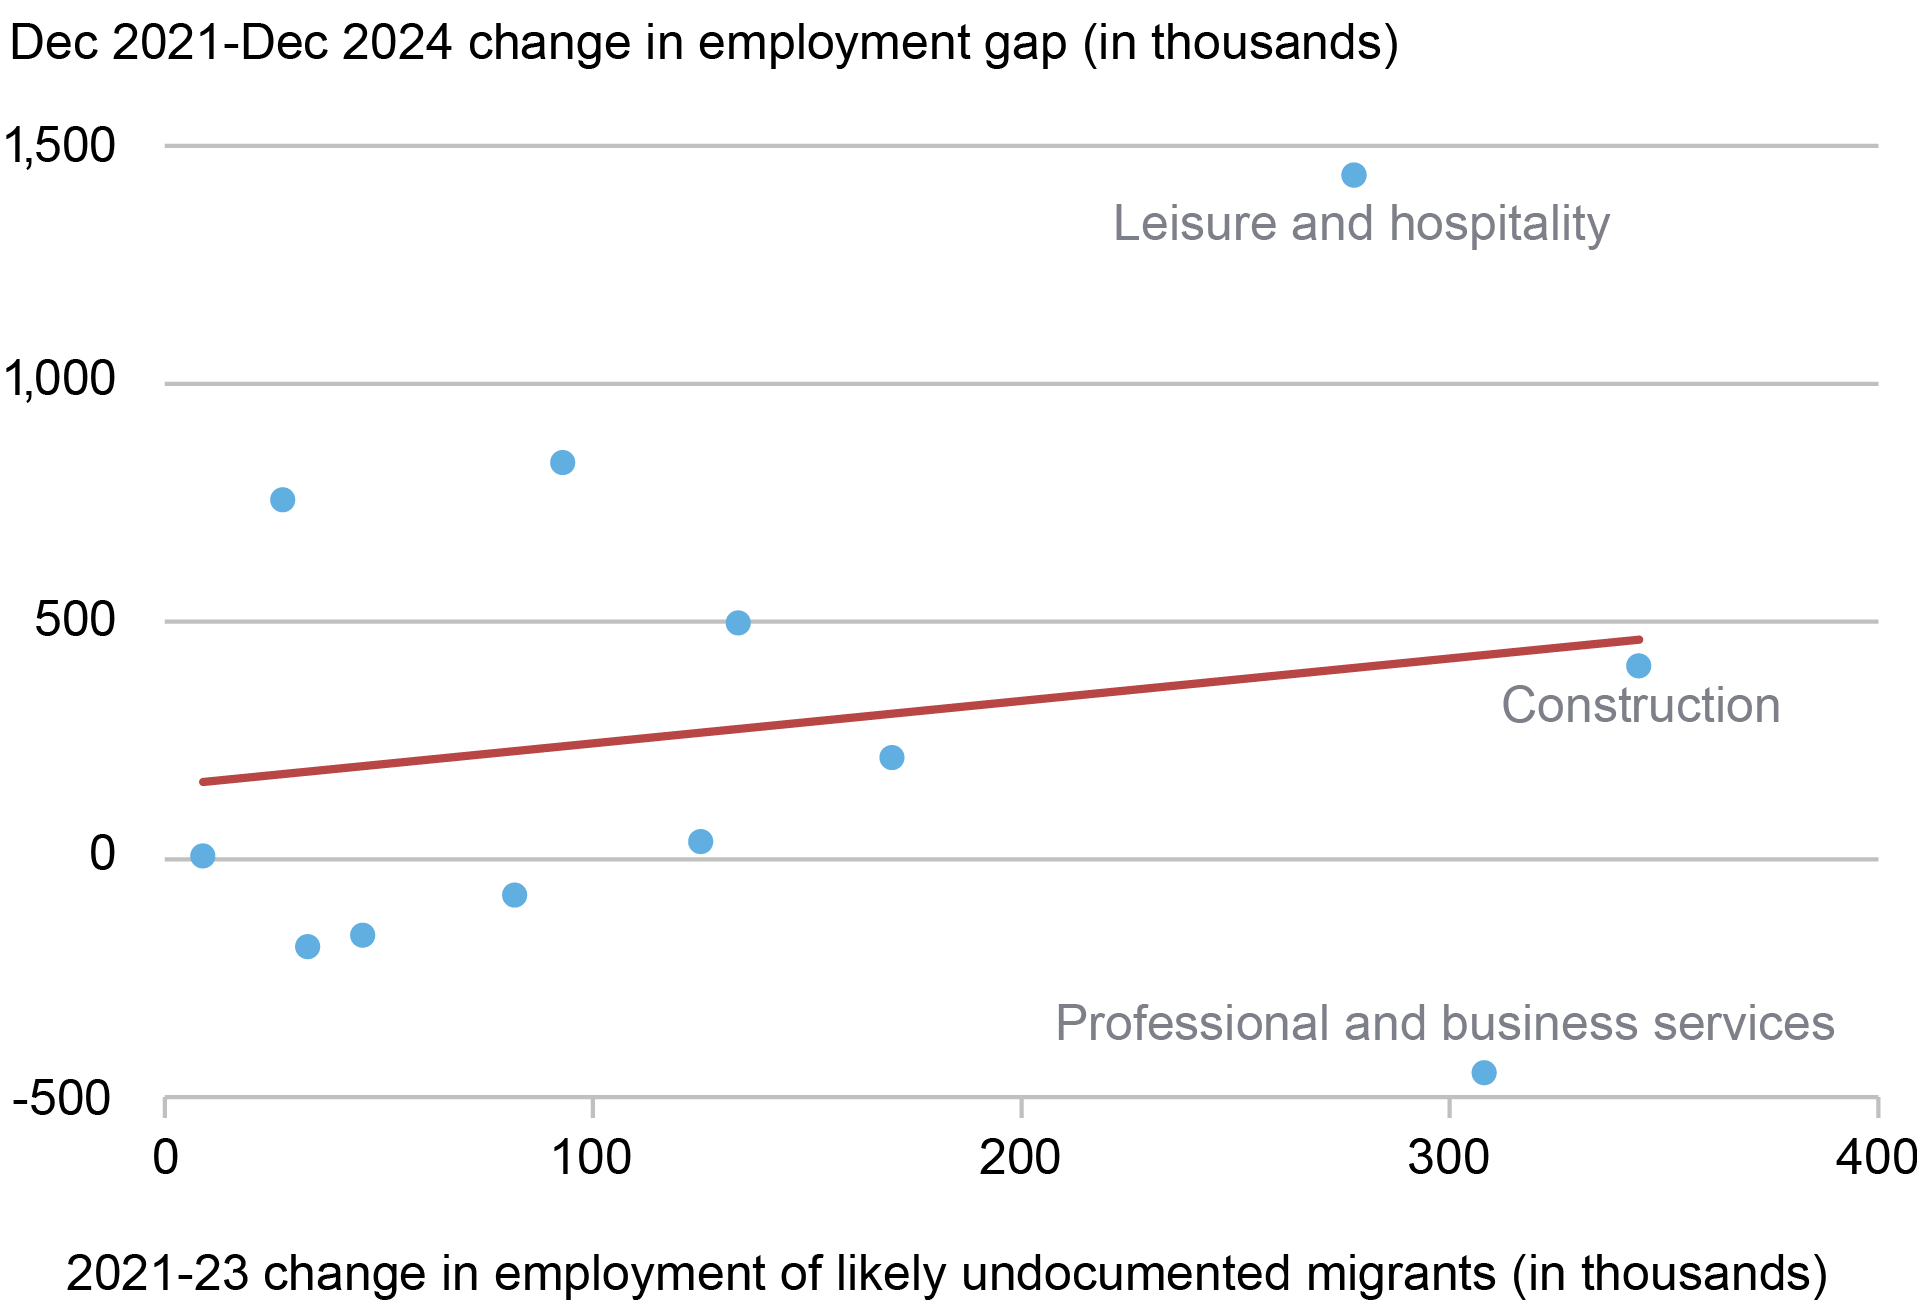
We next formally investigate the relationship between changes in the employment of undocumented migrants at the industry level—derived from the ACS—and changes in the payroll-household employment gap. Although this is not a causal relationship, looking at the evolution of the gap does net out any industry-level time trends, since those should show up in both sets of employment numbers. As shown in the chart below, there is limited support for the role of undocumented immigration as a likely explanation for the divergence between the two employment surveys. The relationship is weakly increasing but not statistically significant. To read the chart, look at the top point for leisure and hospitality, with the employment gap up roughly 1.5 million and the increase in our estimate of undocumented workers up around 0.25 million. The next four largest contributors to the gap have only modest increases in undocumented migrant employment, while construction is the one industry with similar increases. Some key industries also clearly do not support the undocumented immigration explanation. For instance, professional and business services saw a large increase in the employment of undocumented migrants while its contribution to the overall payroll-household gap was limited.

There Is a Positive but Weak Relationship Between the Employment of Undocumented Migrants and the Employment Gap

Point and line chart plotting the December 2021 – December 2024 change in employment gap in thousands (vertical axis) against the 2021-2023 change in employment of likely undocumented migrants in thousands (horizontal axis); the chart shows a positive but weak and not statistically significant increase.
Sources: Bureau of Labor Statistics; American Community Survey; authors' calculations.
Notes: The estimated coefficient on the line of best fit is 0.892 (standard error of 1.44). Public administration is not in the above plot, as employment in this sector is used to identify individuals who are likely not undocumented migrants.

We acknowledge that the absence of a statistical relationship might be driven by measurement error, and specifically by the imputation procedure we use to derive the number of employed undocumented migrants in the ACS. But robustness checks confirm our main finding. For instance, we obtain similar results when using variation in employed undocumented immigrants at the state level. More broadly, our analysis suggests that factors other than undocumented immigration are likely to be behind the payroll-household employment gap.


Richard Audoly is a research economist in the Federal Reserve Bank of New York's Research and Statistics Group.

RoshieXing is a research analyst in the Federal Reserve Bank of New York's Research and Statistics Group.

Disclaimer
The views expressed in this post are those of the author(s) and do not necessarily reflect the position of the Federal Reserve Bank of New York or the Federal Reserve System. Any errors or omissions are the responsibility of the author(s).


~A.